

How to Use SQL in Excel: The Smart Way
Knowing how to use SQL in Excel can save hours and unlock advanced data capabilities. It allows you to query, manipulate, and analyze large datasets with precision, going beyond Excel's traditional functions. SQL is ideal for tasks like merging data from multiple sources, filtering complex information, or performing aggregations and calculations that would otherwise require cumbersome formulas or manual effort.
This guide will walk you through practical steps to set up SQL for Excel and provide examples of writing queries, automating repetitive tasks, and managing data between Excel and SQL Server. It also explores how Enquery makes this process easier and faster by writing your queries automatically and simplifying various other tasks.
Getting Started: How to Use SQL in Excel
Before you can start running queries, you need to connect SQL to Excel. This typically involves a manual setup using a built-in Excel tool, such as Microsoft Query, to establish a connection to your database.
Alternatively, you can use third-party solutions to streamline the process and reduce setup time. For example, with Enquery, you can just import any spreadsheet to begin chatting with your data. Download for free here.
Manual Setup with Microsoft Query
Microsoft Query is a useful tool for retrieving data from external sources and integrating it into your spreadsheets.
To get set up, the first step is to establish the Connection:
Open Excel and navigate to the Data tab.
Select Get Data > From Other Sources > From Microsoft Query.
In the Choose Data Source dialog box, select the appropriate data source (e.g., ODBC, Excel Files, or SQL Server).
Follow the prompts to authenticate and establish a connection to your database.
From here, you can start writing queries with the Query Wizard or SQL Editor.
For example, to retrieve all records from a table called Sales where Region = 'North', you might write:
Run your query to ensure it returns the desired results.
After verifying the results, you can load them by clicking Return Data to Microsoft Excel. In the Import Data dialog box, choose how and where to display the data in your worksheet.
While this method works, Enquery streamlines the process by offering direct file integration, automated SQL workflows, and a user-friendly interface that eliminates the need for extensive configuration or SQL expertise.
With Enquery, you can:
Import your spreadsheet or database connection with just a few clicks.
Use natural language to ask questions like “Show sales by region for Q3,” and Enquery generates the SQL query for you.
Choose between manual control or let the AI handle repetitive tasks automatically.
Enquery eliminates technical barriers, letting you focus on analysis rather than configuration. Plus, the AI can teach you about anything, including how to use SQL in Excel.
Writing and Running SQL Queries in Excel
We’ve shared one SQL for Excel query example, but it’s worth diving into some common queries.
Let’s start with filtering data. Assuming you would like to retrieve sales records for a specific product, you might write:
This query retrieves all columns (SELECT *) from the Sales table for rows where the Product column equals 'Widget A'. The WHERE clause acts as a filter, narrowing down the dataset to include only the relevant sales records.
To aggregate data, such as summarize sales by month, you may write:
This query calculates the total sales for each month in the Sales table. The MONTH(OrderDate) function extracts the month from the OrderDate column, grouping all sales data by month. The SUM(TotalSales) function adds up the sales figures for each group (month), resulting in a summary of monthly sales.
The GROUP BY clause ensures the data is aggregated by the month extracted from OrderDate, producing a concise view of monthly totals.
This query combines data from two tables, Customers and Orders, by matching the CustomerID column in both tables. The JOIN clause establishes the relationship between the tables, ensuring that each customer’s name from the Customers table is paired with their corresponding order details (such as OrderID and TotalAmount) from the Orders table.
If writing queries manually feels daunting, Enquery offers AI-assisted query generation.
You can ask questions in plain English, such as “What were total sales in the West region last month?” Enquery will generate and run the SQL query, showing both the results and the syntax behind it for transparency.
This approach not only saves time but also helps users new to SQL learn through practical application. Use Enquery for 30 days FREE.
Common Ways of Automating Repetitive Tasks with SQL
Here are some common ways to automate tedious Excel tasks like deduplication, merging datasets, and preparing reports.
Cleaning Data: Remove duplicates from a customer list.
This query removes duplicate rows from the Customers table by selecting only unique records. The SELECT DISTINCT clause ensures that any duplicate entries are filtered out.
Merging Data: Combine multiple datasets into a single table.
This query merges the Orders and Payments tables by matching the OrderID column in both tables. The JOIN clause ensures that each order in the Orders table is paired with its corresponding payment status from the Payments table, creating a unified dataset.
Preparing Reports: Generate summaries like total expenses by department.
This query calculates the total expenses for each department by using the SUM(Expenses) function. The GROUP BY Department clause organizes the data into groups based on department names.
Automating Tedious Tasks with Enquery
With Enquery, tasks that require multiple steps in SQL can be done with minimal effort. For example, you can:
Select the sheets you want to merge, and Enquery automatically identifies relationships and creates the necessary joins.
Deduplicate data or clean inconsistencies with a single command, even if you don’t know SQL syntax.
By combining SQL with AI, Enquery reduces time spent on manual tasks and minimizes errors.
Advanced SQL Techniques for Excel Power Users
Once you’re comfortable with basic SQL queries, you can explore advanced techniques that can supercharge your Excel workflows.
Nested Queries for Complex Analysis
Nested queries are great if you need multiple layers of data processing. They allow you to rank, filter, and group data dynamically within a single command.
For example, you may write something like this to find the top 5 products by sales in each region:
In this query, the inner statement calculates the total sales for each product within each region using the SUM(Sales) function. The RANK() function is then applied to assign a rank to each product within its region, ordered by total sales in descending order. The PARTITION BY Region clause ensures that the ranking starts over for each region, grouping products appropriately.
The outer query filters the results to include only the top 5 products in each region based on the ranking generated in the inner query. This final result provides a dynamic analysis of product performance across regions, showing the Region, Product, and TotalSales for the top performers.
Nested queries like this are powerful for streamlining complex analysis, as they eliminate the need for multiple separate queries or manual calculations in Excel.
With Enquery, you can replicate this analysis in seconds by defining your goals and letting the AI generate the query.
Aggregating Data for Dynamic Dashboards
Using SQL, you can easily calculate metrics for dashboards directly in Excel. For example, you may write the following to calculate monthly revenue:
This query extracts and summarizes revenue data from the Orders table. The MONTH(OrderDate) function breaks the order dates into months, grouping all sales that occurred in the same month. The SUM(TotalAmount) function calculates the total revenue for each month. The GROUP BY clause ensures that the data is aggregated by month, allowing you to see monthly revenue trends in your dataset.
This approach streamlines calculations that would otherwise require multiple steps in Excel, making it easier to prepare metrics for visual dashboards or reports.
With Enquery, you can automate the aggregation process and create polished visuals, making it easy to present and share insights.
Reusable Views for Recurring Reports
If you find yourself running the same analysis repeatedly, SQL views can save time. A view acts like a saved query that you can call whenever needed. For example:
This code creates a SQL view named HighValueCustomers. The view aggregates sales data from the Orders table and identifies customers whose total sales exceed $5,000. The SUM(Sales) function calculates the total sales per customer, and the GROUP BY CustomerName clause ensures the totals are grouped by each customer’s name.
By saving this query as a view, you can quickly retrieve the list of high-value customers without rewriting the query each time. For example, you can query this view like a regular table by writing:
Enquery enhances this concept by letting you save workflows and queries within its interface. You can reuse them across projects, adding flexibility and efficiency to your reporting.
Importing and Exporting Data Between Excel and SQL Server
SQL makes it easy to move data back and forth without manual copy-pasting or formatting errors. Here’s how to streamline both importing and exporting.
Importing Data from Excel to SQL Server
Getting data from Excel into SQL Server is a common task, especially when consolidating or preparing datasets for analysis. You can typically do it as follows.
1. Use SQL Server Management Studio (SSMS)
Open SSMS, right-click your database and select Tasks > Import Data.
Choose Excel as the source file and follow the wizard to map columns between your Excel sheet and the SQL table.
Validate the mappings and complete the import process.
This approach works well but can be tedious for large or complex datasets.
2. Use Bulk Insert for Larger Datasets
For faster imports, convert your Excel file to a CSV format and use SQL commands to bulk load data.
This method is ideal for handling thousands of rows but requires clean and properly formatted data.
3. Data Import with Enquery
With Enquery, importing data is much faster and easier. Just upload your Excel file, and Enquery maps your data to the appropriate SQL table automatically. The AI will resolve formatting mismatches to ensure a smooth transfer without requiring you to edit source files.
Exporting Data from SQL Server to Excel
Exporting query results into Excel is often necessary for sharing reports or creating visual dashboards.
You can perform a manual export via SSMS.
First, run your SQL query in SSMS.
Next, right-click the query results and choose Save Results As to export them as a CSV or Excel file.
Open the file in Excel to format and analyze the data further.
With Enquery, the approach is more integrated. Results are saved directly in Excel-friendly formats, ready for immediate use. You can also add visual elements like charts or pivot tables, all generated automatically by the platform.
Comparing Tools for SQL in Excel
Not all SQL tools are created equal. Here’s how traditional options stack up against Enquery, an AI-powered solution.
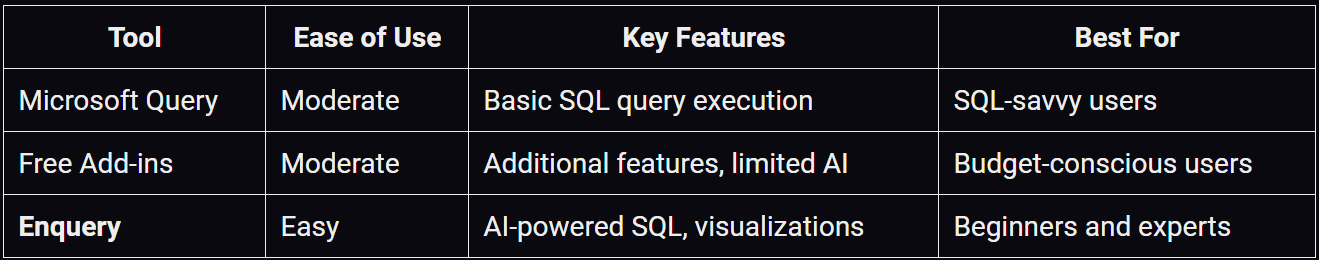
Enquery combines SQL’s power with AI’s simplicity
Automated Workflows: Eliminate repetitive tasks like joins, deduplication, and data aggregation with minimal effort.
Natural Language Querying: Skip manual setup by using plain language to generate SQL queries.
Dynamic Reporting: Create polished dashboards and dynamic reports with ease.
User-Friendly Interface: Designed for simplicity. Makes powerful tools accessible even to non-technical users.
Data Security: Keep your data private with secure, local processing that ensures full control over your files.
Enquery empowers you to work smarter. Save hours by trying Enquery for FREE today!
FAQs and Troubleshooting
What is SQL in Excel?
Wondering how to use SQL in Excel? SQL in Excel refers to the use of Structured Query Language (SQL) to query, filter, and analyze data within or connected to an Excel workbook. It bridges Excel's familiar interface with the robust querying power of SQL, enabling you to perform tasks like filtering, joining, and aggregating data efficiently.
With tools like Microsoft Query and Power Query, Excel supports SQL integration. Enquery makes this even easier by allowing you to generate SQL queries or ask questions in plain English, delivering results without requiring extensive SQL expertise.
How to run an SQL query in Excel?
To run an SQL query in Excel:
Use the Get Data feature in the Data tab to connect to a database.
Open Microsoft Query or another add-in to write and execute your SQL query.
Load the results back into Excel for analysis.
With Enquery, the process is simpler, allowing you to generate and execute queries with natural language commands.
What are SQL queries in Excel used for?
SQL queries in Excel are powerful for tasks like:
Filtering and sorting large datasets.
Aggregating data for totals, averages, and other calculations.
Joining tables for unified reports.
Automating data preparation tasks such as deduplication and validation.
Why isn’t my SQL query running in Excel?
There are various possible reasons why this may be occurring.
Syntax errors: Double-check for typos or missing keywords.
Connection issues: Ensure your database connection is active and correctly configured.
Data format mismatch: Verify that column types (e.g., text vs. numbers) align between your query and the database schema.
Remember that Enquery’s real-time feedback pinpoints errors, suggest corrections, and simplifies debugging, ensuring your queries run smoothly.
Can SQL be used without learning complex syntax?
Absolutely! Enquery allows you to interact with SQL using plain English. For example:
“Show sales by product category.”
“Calculate average revenue for the last three months.”
The AI translates these questions into SQL queries, explains the logic, and helps you learn SQL concepts naturally as you work.
How can I import data from Excel to SQL Server?
Excel data can be imported into SQL Server through SQL Server Management Studio (SSMS) or by using commands like BULK INSERT. Enquery simplifies this by automatically mapping and formatting your data for a smooth transfer, saving time and effort.
What is an Excel SQL add-in?
An Excel SQL add-in is a tool that extends Excel’s functionality, allowing users to integrate SQL querying capabilities directly into their spreadsheets. These add-ins enable seamless connections to databases, making it easier to run queries, analyze data, and automate workflows without leaving Excel.
While Enquery is not an add-in, it surpasses the limitations of traditional add-ins by offering a standalone platform that integrates seamlessly with your spreadsheets. Enquery combines SQL’s power with AI to simplify complex tasks like data merging and deduplication, and it allows you to generate SQL queries using plain English, making it accessible to users of all skill levels.
You may also like this: Spreadsheet vs Database


